Data Dashboards

One screen for foot traffic, lodging tax, leads, and KPIs your board actually asks about.

Most communities are buried in tools — Placer.ai, Smith Travel Report, Google Analytics, lodging tax spreadsheets, CRM reports — and starved for clarity. We build custom dashboards that pull everything into a single board-ready view your team can actually use.

Outcomes

What success looks like

  • Faster, more confident decision-making at the staff and board level
  • Defendable budget conversations with real data
  • Less time spent assembling monthly reports manually
  • Better grant applications backed by community data
  • Higher transparency for residents and members

Why Southwind

Built for the way your organization actually works

Source-of-truth dashboards

Placer.ai foot traffic, STR lodging, Google Analytics, CRM, and financial data unified into one report.

Board-ready

Designed to be screen-shared in a board meeting or dropped into a council packet without reformatting.

Real-time when it matters

Live data refresh where the use case demands it; scheduled refresh where it doesn't.

Built on tools you can keep

Google Looker Studio, Power BI, Metabase, or custom React — chosen to fit your team's skills and budget.

Trained team

Your staff learns to read, filter, and adjust the dashboards — not just receive them.

Storytelling layer

Every dashboard includes a written interpretation layer so the data tells a story, not just numbers.

What's Included

A complete scope — not a list of disconnected tasks

Data audit

Inventory of your existing tools, data sources, and reporting needs.

Dashboard design

Wireframes and metric definitions approved before any build.

Build & integration

Looker Studio, Power BI, Metabase, or custom React dashboards wired to your data sources.

Placer.ai integration

Foot traffic, dwell time, and visitor-origin data brought into the dashboard.

STR / lodging integration

Lodging performance and tax-collection trends visualized for tourism clients.

Training & documentation

Live training, recorded video, and written documentation for your team.

Our Process

How we deliver

  1. 01

    Inventory

    Map every data source you have and every report your board, council, or members ask for.

  2. 02

    Design

    Wireframe the dashboards and lock metric definitions so everyone agrees what a number means.

  3. 03

    Build

    Implement on the platform that fits, integrate every source, and validate the data.

  4. 04

    Train

    Live training and a documentation library so your team can run the dashboards without us.

Who It's For

Organizations we serve with this work

  • Cities tracking budget, capital projects, and resident services
  • Tourism boards combining STR, Placer.ai, and lodging tax
  • EDOs reporting on attraction, retention, and talent KPIs
  • Chambers tracking membership, events, and sponsorship
  • Main Street programs tracking foot traffic and vacancy

Portfolio

Some Dashboard Examples

A sample of dashboards we've built across law enforcement, public administration, environmental monitoring, and economic analysis.

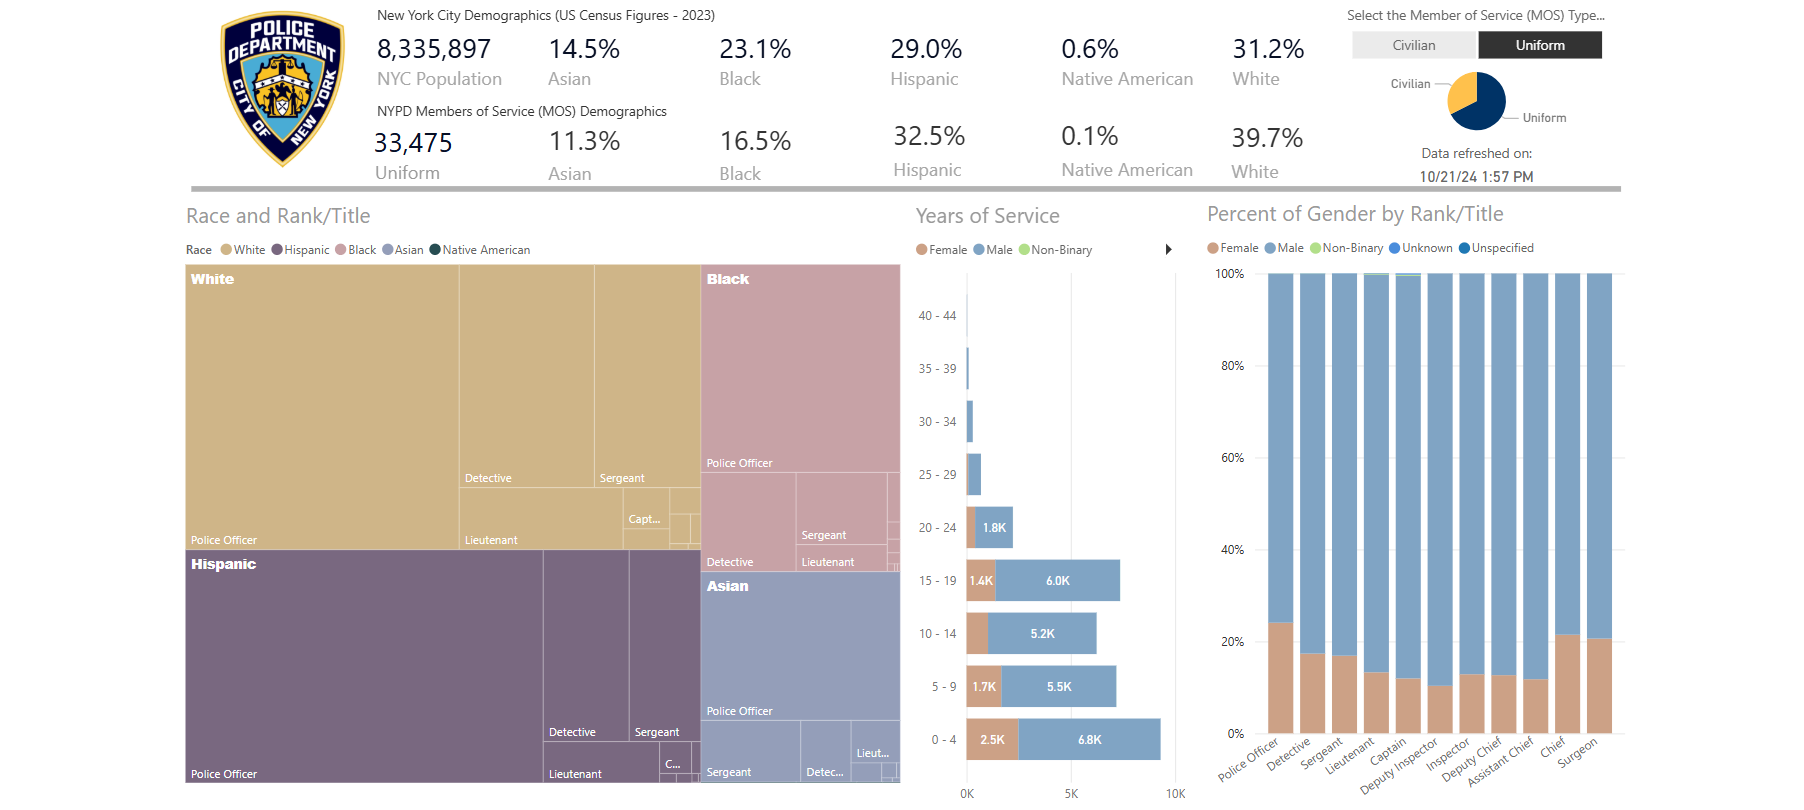
NYPD City Demographic

NYPD City Demographic

Demographic data visualization for New York City, built to surface population trends across precincts and boroughs.

View →
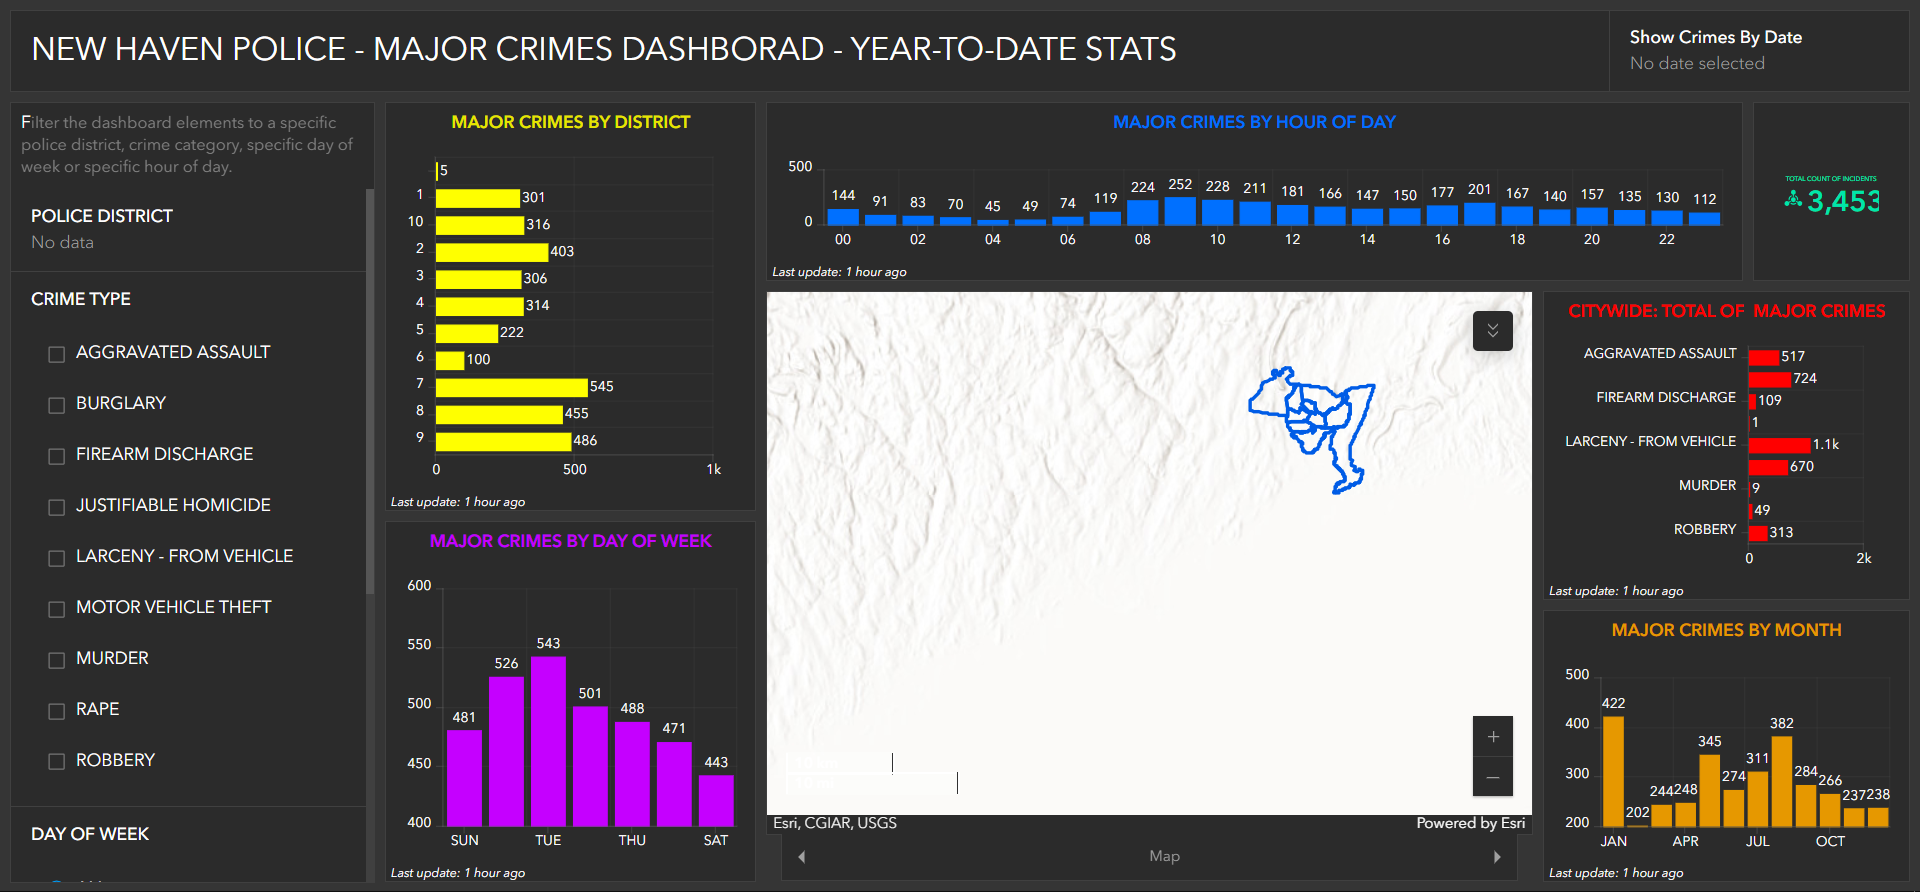
NHPD Major Crimes Dashboard

NHPD Major Crimes Dashboard

Crime analytics dashboard for a police department, presenting incident trends, category breakdowns, and geographic distribution.

View →
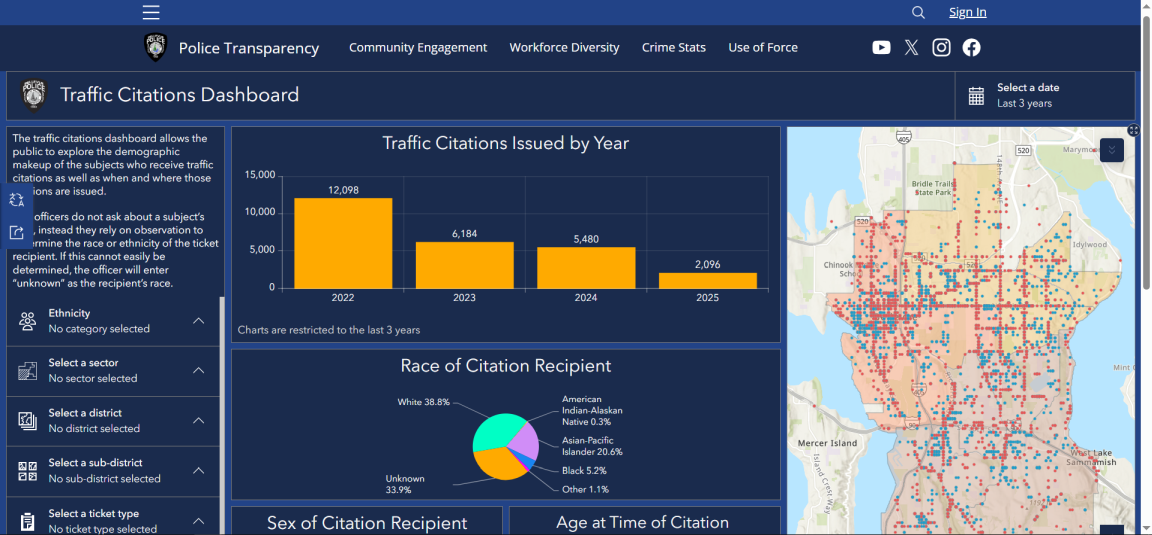
City of Bellevue Police Transparency Dashboard

City of Bellevue Police Transparency Dashboard

Public-facing transparency dashboard covering traffic citations, giving residents clear visibility into enforcement data.

View →
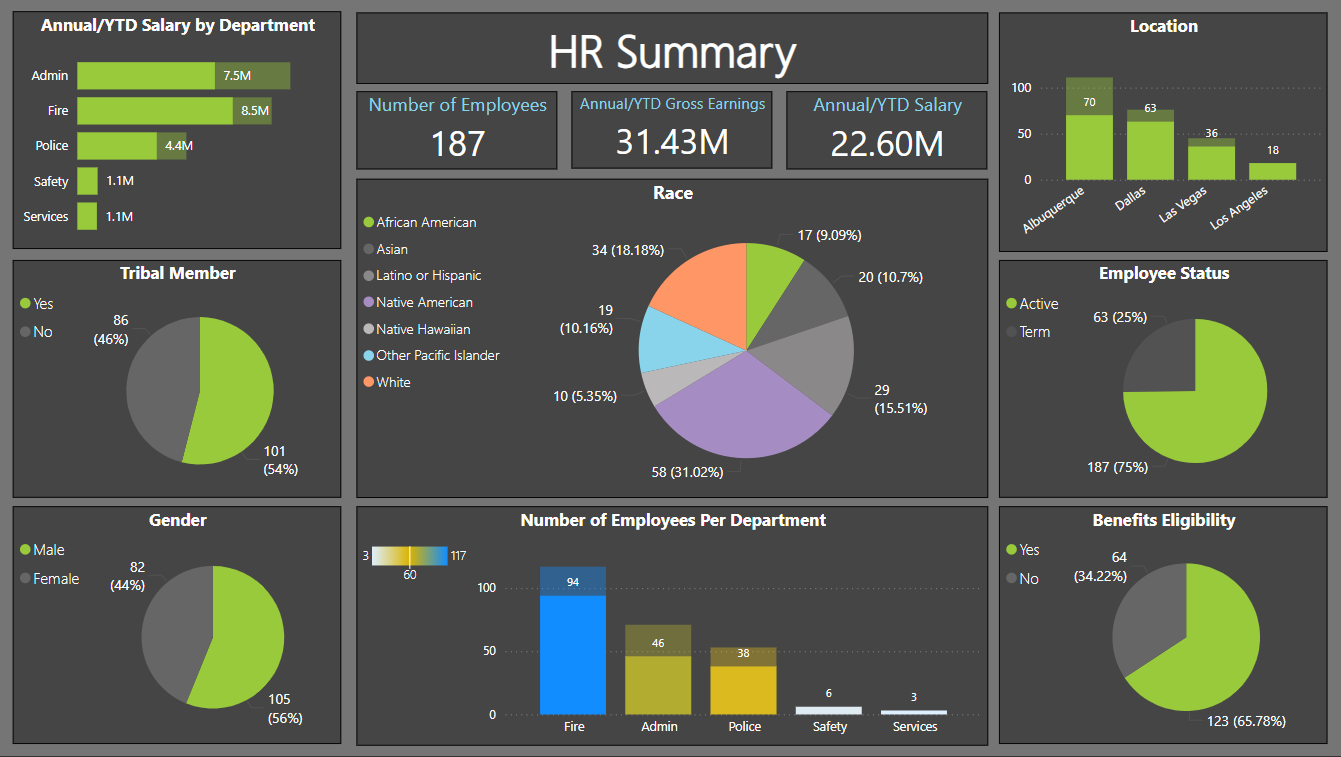
HR Summary Dashboard

HR Summary Dashboard

Human resources metrics dashboard tracking headcount, turnover, and employee-related KPIs for organizational leadership.

View →
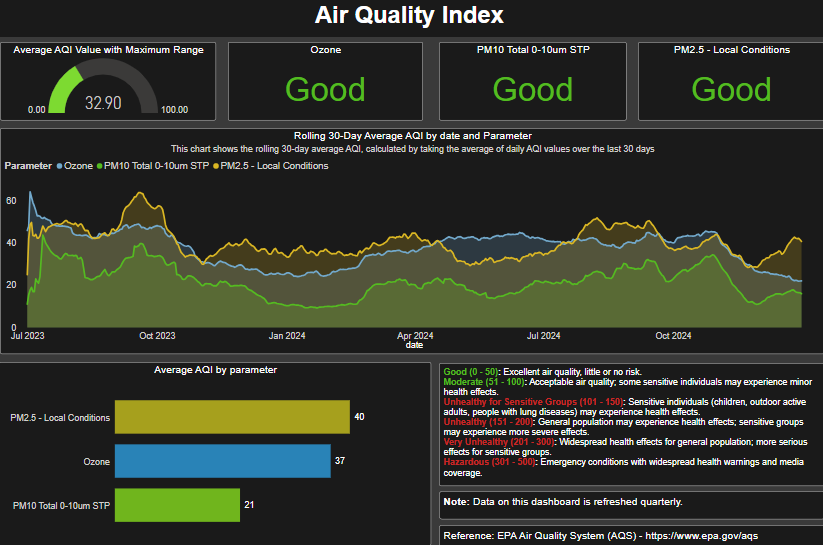
Air Quality Index

Air Quality Index

Environmental monitoring dashboard visualizing air quality measurements and index trends across a regional geography.

View →
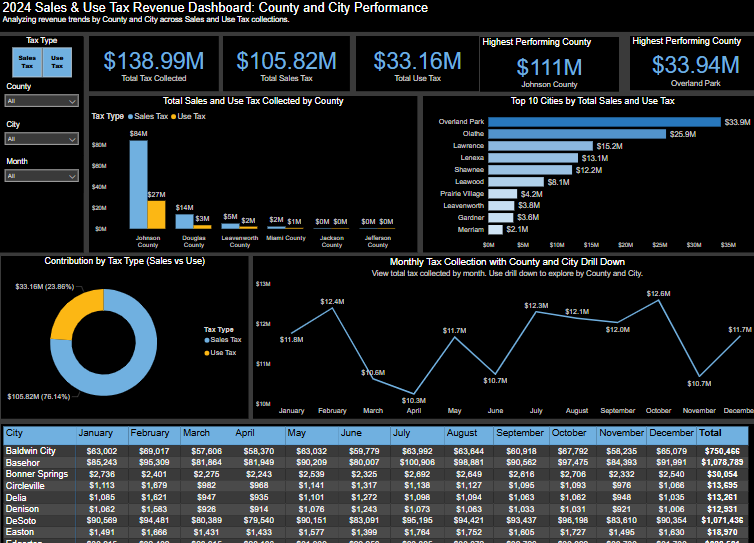
Sales Tax

Sales Tax

Financial intelligence dashboard tracking sales tax revenue trends, seasonal patterns, and year-over-year comparisons.

View →
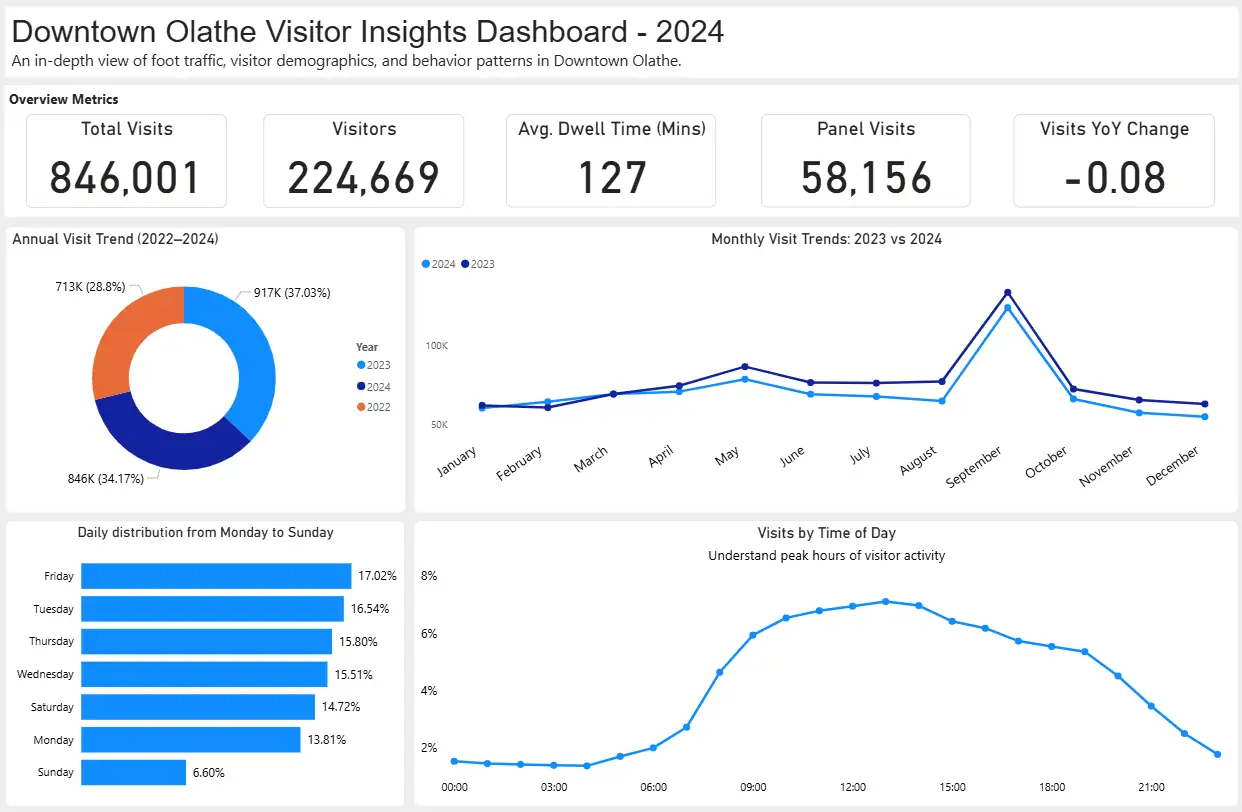
Foot Traffic Dashboard

Foot Traffic Dashboard

Pedestrian movement and visitor flow analytics for downtown and retail districts, powered by location intelligence data.

View →
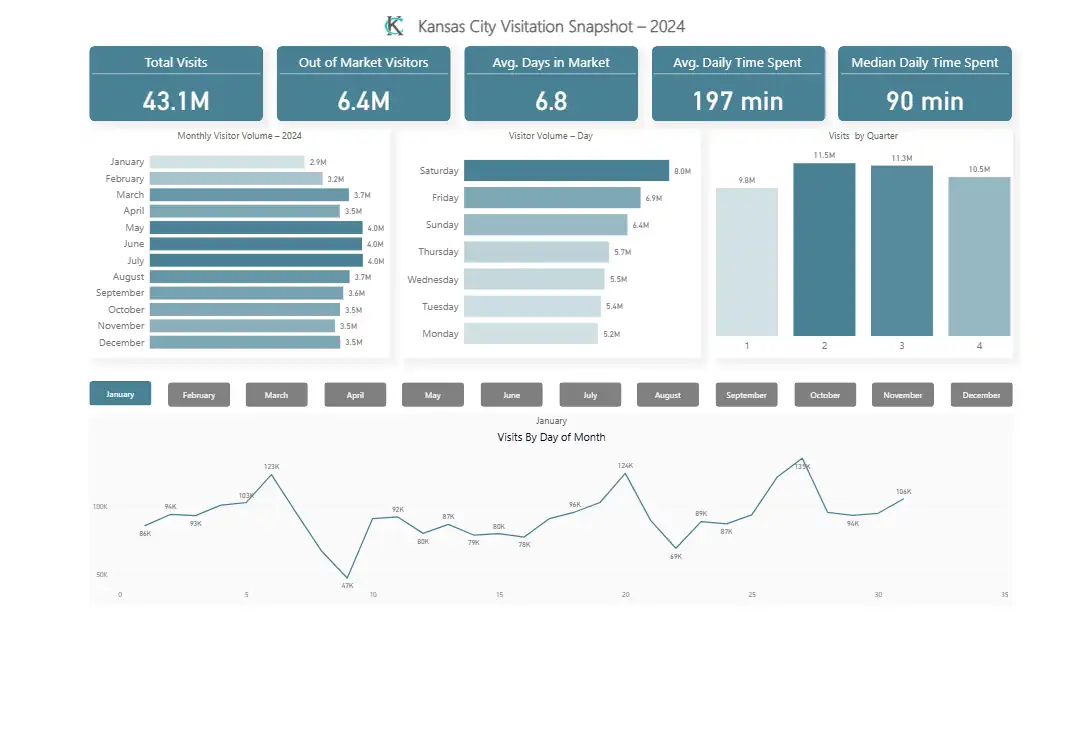
Kansas City Visitation Insight

Kansas City Visitation Insight

Tourism and visitor statistics dashboard displaying origin markets, dwell time, and seasonal visitation patterns for Kansas City.

View →

FAQ

Frequently asked questions

Which dashboard platforms do you build on?
Google Looker Studio (the most cost-effective for most clients), Power BI (when an organization is standardized on Microsoft), Metabase (for SQL-comfortable teams), or custom React dashboards for unique requirements.
Do you work with Placer.ai data?
Yes. Placer.ai is one of the most common sources we integrate for tourism, downtown development, and economic development clients.
What about Smith Travel Report (STR)?
Yes. We integrate STR lodging performance into tourism dashboards so STR's monthly reports show up alongside Placer.ai, paid media, and lodging tax data.
Do you train our staff?
Yes. Live training, a recorded video library, and written documentation are included so your team owns the dashboards long-term.

Let's talk

Ready to grow your community or organization?

Schedule a free consultation and we'll map a practical plan for your goals, your team, and your budget.
Get a Free Consultation