
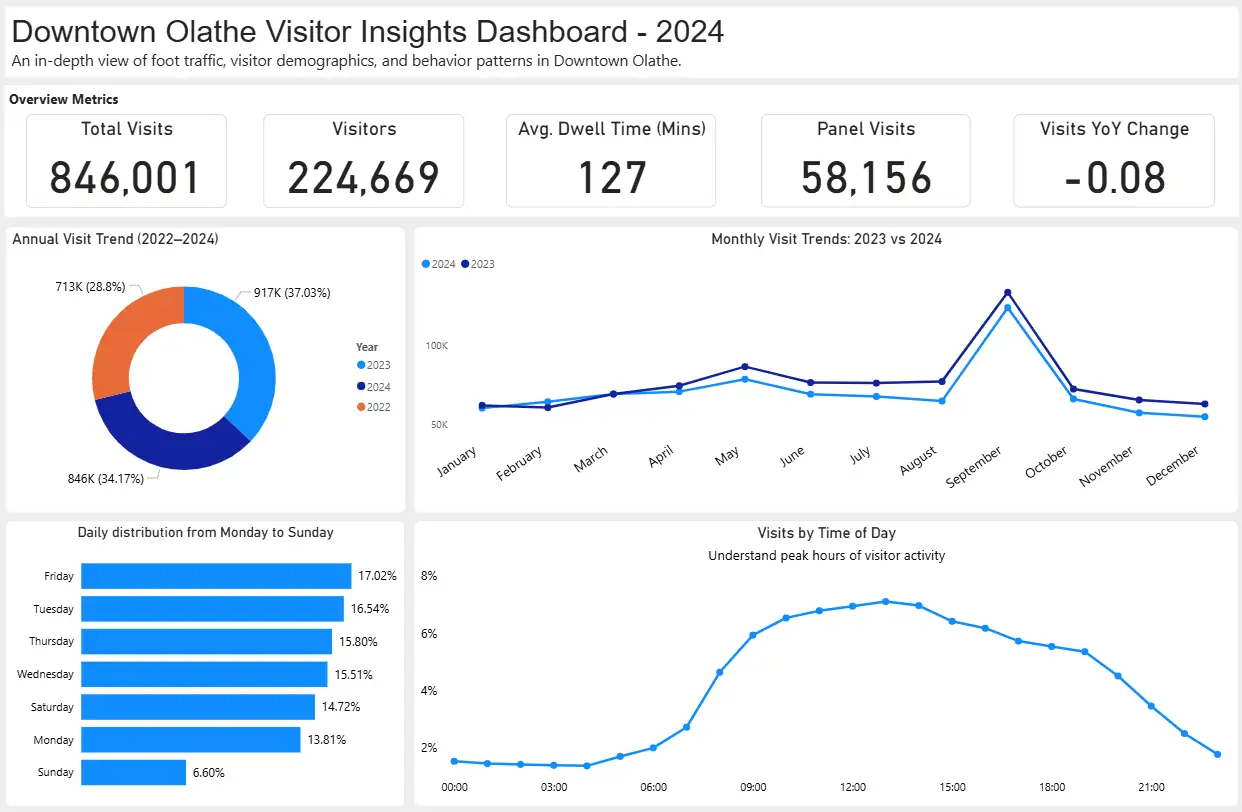
Local governments are expected to do more with less—faster, smarter, and more transparently. But decision-making without clear, real-time data often leads to delays, misallocation, or public frustration. That’s where custom data dashboards come in. At Southwind Marketing, we help cities, counties, and economic development agencies turn raw data into simple, actionable visuals.
Key Metrics and KPIs for Municipal Dashboards
Most municipal dashboards track KPIs with a progress indicator toward a predefined goal, not just a raw number. Common ones:
- Budget status: General fund revenue versus expenditures, flagged early enough to adjust spending.
- Fiscal health: Trends in free cash, stabilization fund balances, and uncollected real estate taxes, showing whether reserves can absorb a bad year.
- Service delivery: Permit turnaround and infrastructure maintenance, pointing staff to where backlogs are forming.
- Tourism and tax revenue: Sales tax by sector and event attendance, showing which parts of the local economy are growing.
Dashboards and Public Transparency
The City of North Bay launched a public-facing municipal dashboard in 2026 so residents could see the city’s organizational performance and key community measures directly, rather than through a summary report. Combining community statistics with KPIs on one public page gives residents a clearer read on both their community and how well city programs and services are actually performing. A municipality ready to try this can start by publishing one dashboard (budget or service delivery works well) on its website before expanding to others.
Implementation Challenges and Solutions
Rolling out dashboard reporting runs into predictable friction:
- Scattered data sources: Municipal dashboards often pull from required submissions, annual financial statements, state agency databases, and US Census data. Standardize a single intake format and update schedule before building any visuals.
- Limited staff time: Assign one data owner per department rather than expecting every employee to maintain their own numbers.
- Resistance to change: Start with one KPI staff already report on, like permit turnaround, so the dashboard replaces an existing task instead of adding a new one.
What Is a Government Data Dashboard?
A custom dashboard visually displays your key metrics—sales tax trends, tourism impact, crime stats, EMS calls, or website engagement—in real time. It puts your internal and public data in one place for smarter, faster decisions.
Benefits of Dashboards for Cities & EDCs
Transparency: Share data with council, residents, and stakeholders clearly.
Efficiency: Track performance without digging through PDFs or spreadsheets.
Funding & Grants: Visuals help secure funding by proving impact.
Tourism & Economic Development: Understand visitor patterns, sales tax performance, or what events drive business.
Dashboards Southwind Has Built
- Sales tax and tourism dashboards for rural Kansas & Oklahoma cities
- Police, Fire, EMS, and budget reporting tools
- Chamber membership + event ROI analytics
- Website and digital marketing dashboards for visitor engagement
How We Make It Simple
No IT team? No problem. We build dashboards that you can update and manage—or we handle it for you on a monthly retainer.
Want to see a demo or learn what a dashboard could look like for your city or organization? Contact us here or schedule a free 15-minute walkthrough with our team.