
PROJECT OVERVIEW
The City of Liberal partnered with Southwind Marketing to implement a modern Business Intelligence (BI) dashboard system designed to improve how internal data is used for forecasting, strategic planning, and operational decision-making.
The City’s goal was to move beyond static reports and spreadsheets and create a visual, interactive data environment that allows leadership and staff to quickly identify trends, compare performance over time, and support data-driven goal setting across economic development, tourism, finance, and internal operations.
A core focus of this project was ensuring the dashboards could be used to forecast future conditions, benchmark performance against surrounding communities, and support transparent, efficient governance—while maintaining strict control over sensitive and confidential data.
All dashboards were built and deployed entirely within the City of Liberal’s Microsoft Power BI environment, ensuring full data ownership, security, and long-term sustainability.
OBJECTIVES
- Create clear visual representations of complex city data for leadership and staff
- Support internal forecasting and long-range strategic planning
- Enable trend comparison across time and peer or surrounding communities
- Improve transparency and efficiency in local government reporting
- Reduce reliance on manual spreadsheets and ad-hoc reporting
- Train City staff to independently build and manage dashboards
- Maintain strong governance over sensitive and restricted data
SOLUTION DELIVERED
Southwind designed and implemented a multi-module Power BI dashboard system aligned with how City staff actually use data to make decisions. The dashboards were structured to support both high-level executive review and detailed departmental analysis, allowing the City to use a single platform for leadership briefings, staff planning, and operational management.
CORE DASHBOARD MODULES
Economic Development & Events
- Event counts and attendance tracking
- Event categorization and trend analysis
- Historical comparisons to support planning and funding decisions
Tourism & Visitor Analytics
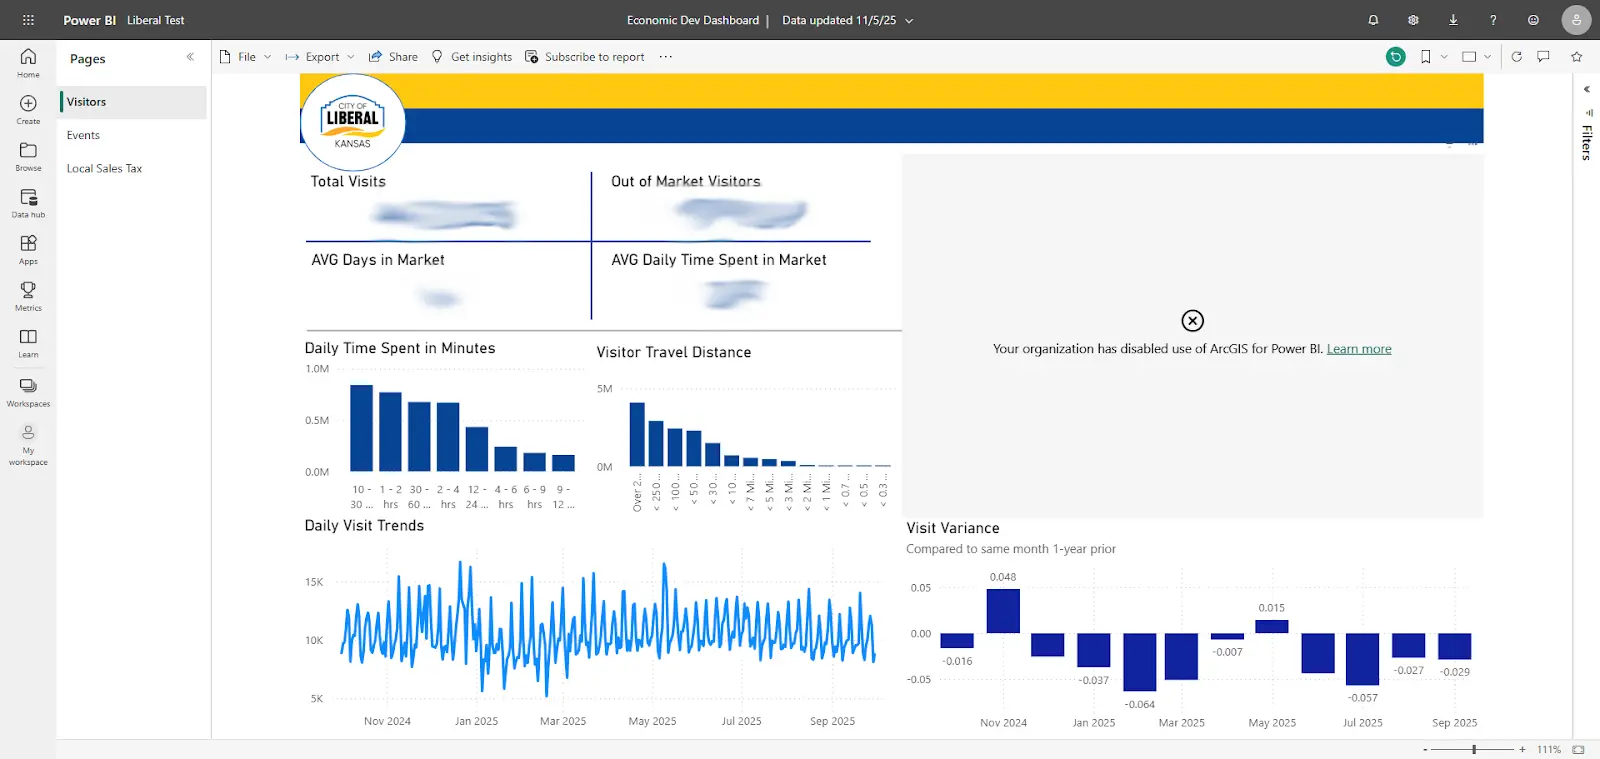
- Total visits and out-of-market visitors
- Length of stay and time spent in market
- Visitor travel distance and origin analysis
- Year-over-year visitation comparisons
Local Sales Tax & Budget Analysis
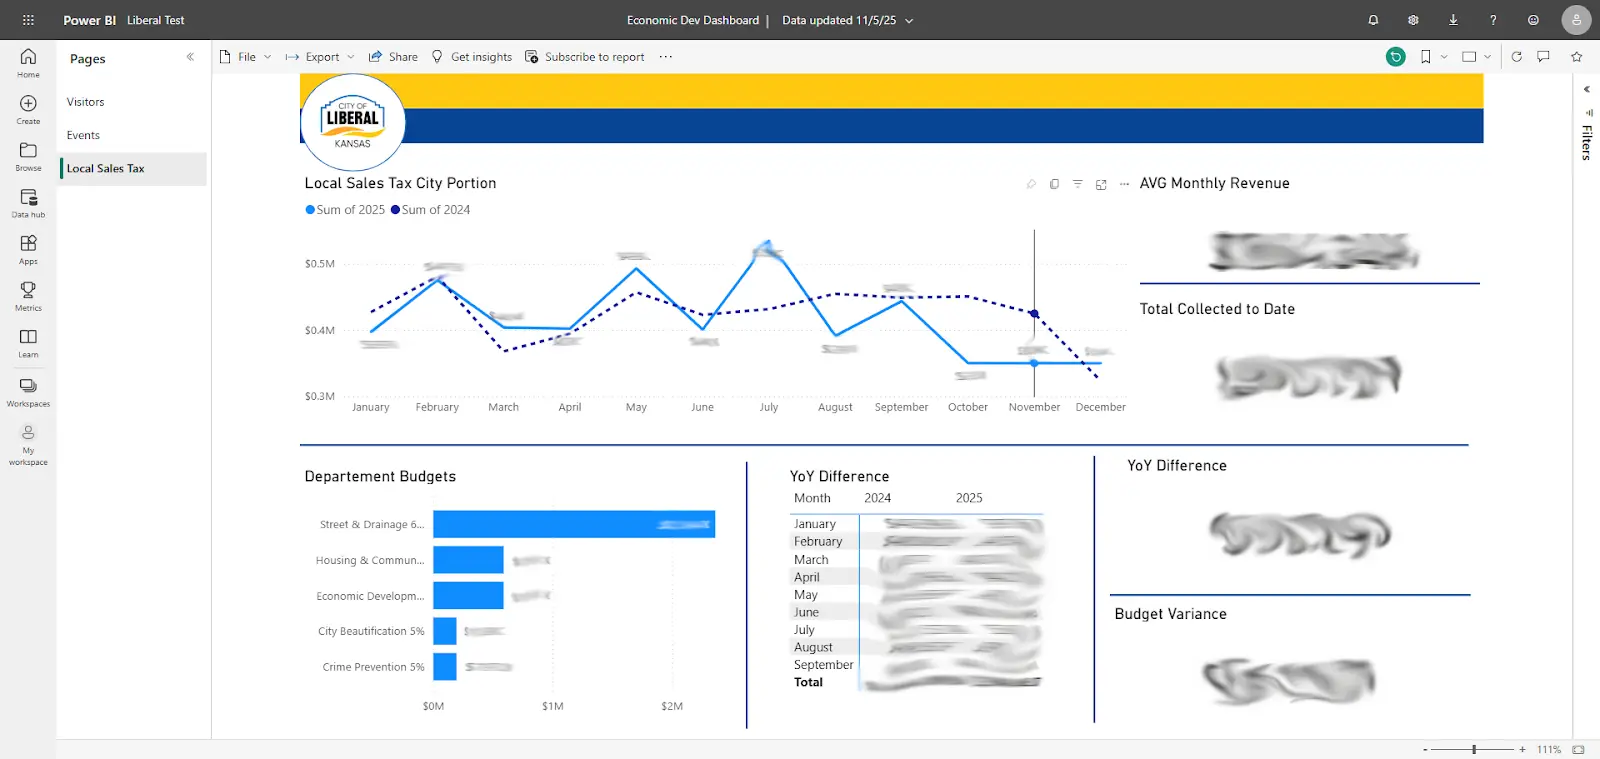
- Monthly and annual revenue trends
- Year-over-year comparisons
- Department-level budget allocations
- Budget and revenue variance analysis
INTERNAL TRAINING & SENSITIVE DATA ENABLEMENT
A critical component of this engagement was internal capacity-building, particularly for sensitive and restricted datasets. Southwind trained the City’s IT Director to independently create and manage secure, role-based dashboards for departments handling confidential information, including Police, Fire, and HR.
This approach ensures sensitive data remains under City control while still being presented in a clear, usable format that improves internal decision-making for department leadership and staff. The City now has the ability to expand analytics internally without vendor dependence or compromising data governance.
RESULTS & IMPACT
- Improved internal visibility into economic, tourism, and financial trends
- Stronger forecasting and strategic planning capabilities
- More informed internal decision-making across departments
- Reduced manual reporting and spreadsheet dependency
- Increased transparency and efficiency in government operations
- Long-term sustainability through City-owned infrastructure and trained staff
"Southwind helped us move beyond static reports and into a more strategic use of data. The dashboards give our team clearer visibility into trends and help us have better conversations internally and with our commission. Just as important, our staff was trained to manage and expand the system, keeping ownership and decision-making with the City." — Scarlette Dieseker, City Manager, City of Liberal, Kansas
Interactive Dashboards Delivered
Spanning economic development, tourism, events, sales tax, budgeting, and internal operations.
City-Owned Data & Infrastructure
All dashboards built and hosted within the City of Liberal’s Microsoft Power BI environment.
Internal Teams Enabled
City IT staff trained to manage dashboards independently, including Police, Fire, and HR use cases.
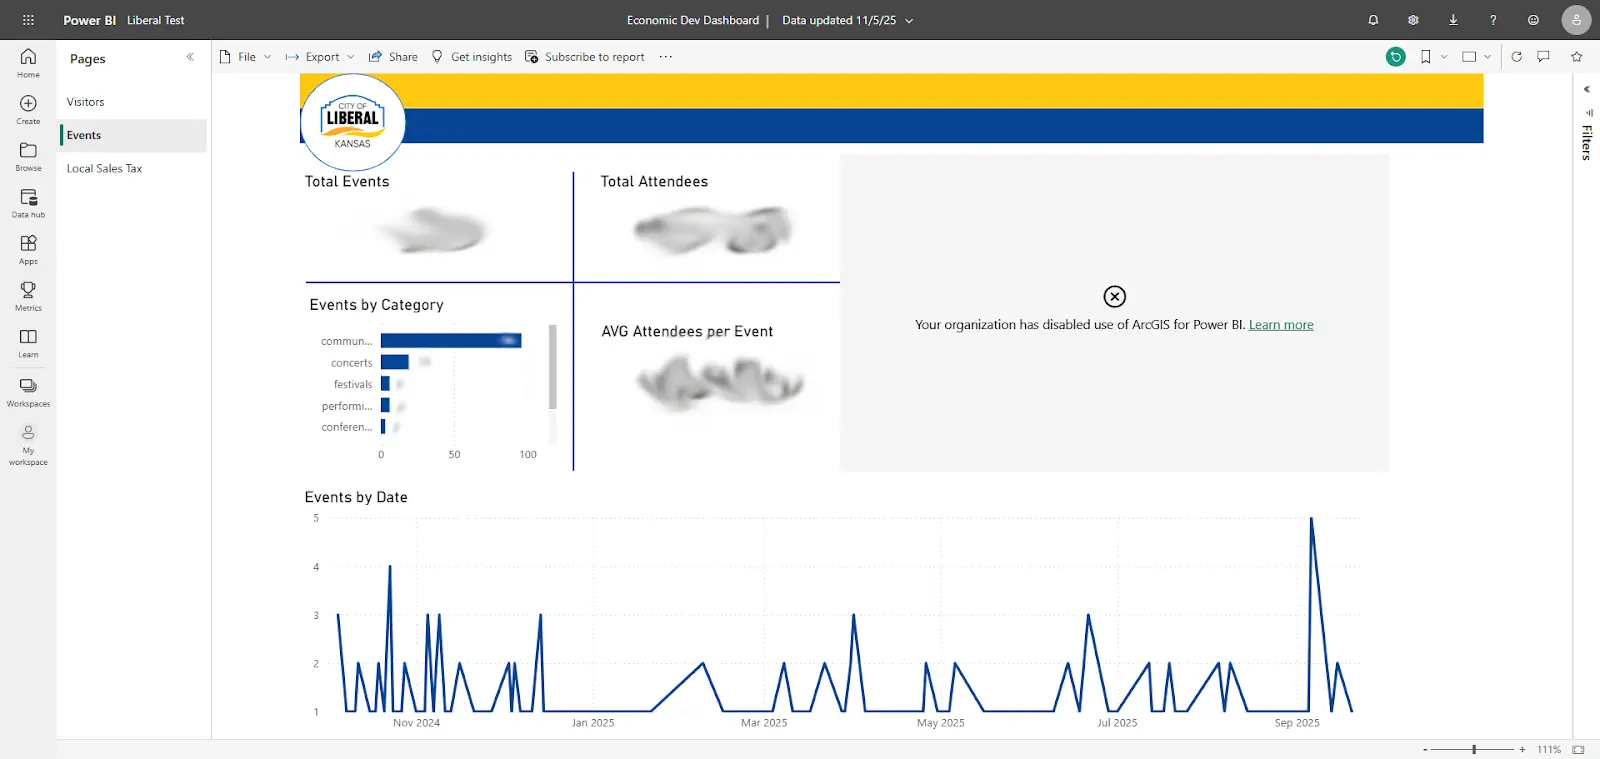
Economic Development & Events Dashboard
Interactive dashboard showing total events, attendance, event categories, and trend analysis.
Tourism & Visitor Analytics Dashboard
Visitor behavior analysis including travel distance, time spent in market, and year-over-year trends.
Local Sales Tax & Budget Dashboard
Sales tax performance, department budgets, and variance analysis for financial planning.
TECH STACK USED
- Microsoft Power BI
- Microsoft 365 (City-owned tenant)
- Secure City-managed data sources